Quantitative Data Classification
This first set of maps shows the median monthly cost of renting in Vancouver based on the data from the 2016 long-form census of Canada, organized by census tract. All four maps use the same data, but each uses a different classification scheme to represent the data: Manual Breaks, Equal Intervals, Natural Breaks and Standard Deviation. Each classification scheme has its disadvantages, which depend on the data set. These may include classifications that give an erroneous impression of the data – for example, that it is more homogenous than it is truly is. More concretely, in the case of this lab, a certain classification method may give the impression that renting in Vancouver is less costly that it truly is, as appears to be case with the Equal Intervals and Standard Deviation maps.
Natural Breaks is always the most accurate means of data classification. The downside to this method, however, is that it may produce breaks that are not easily “digestible,” i.e., not relatable to real world experience.

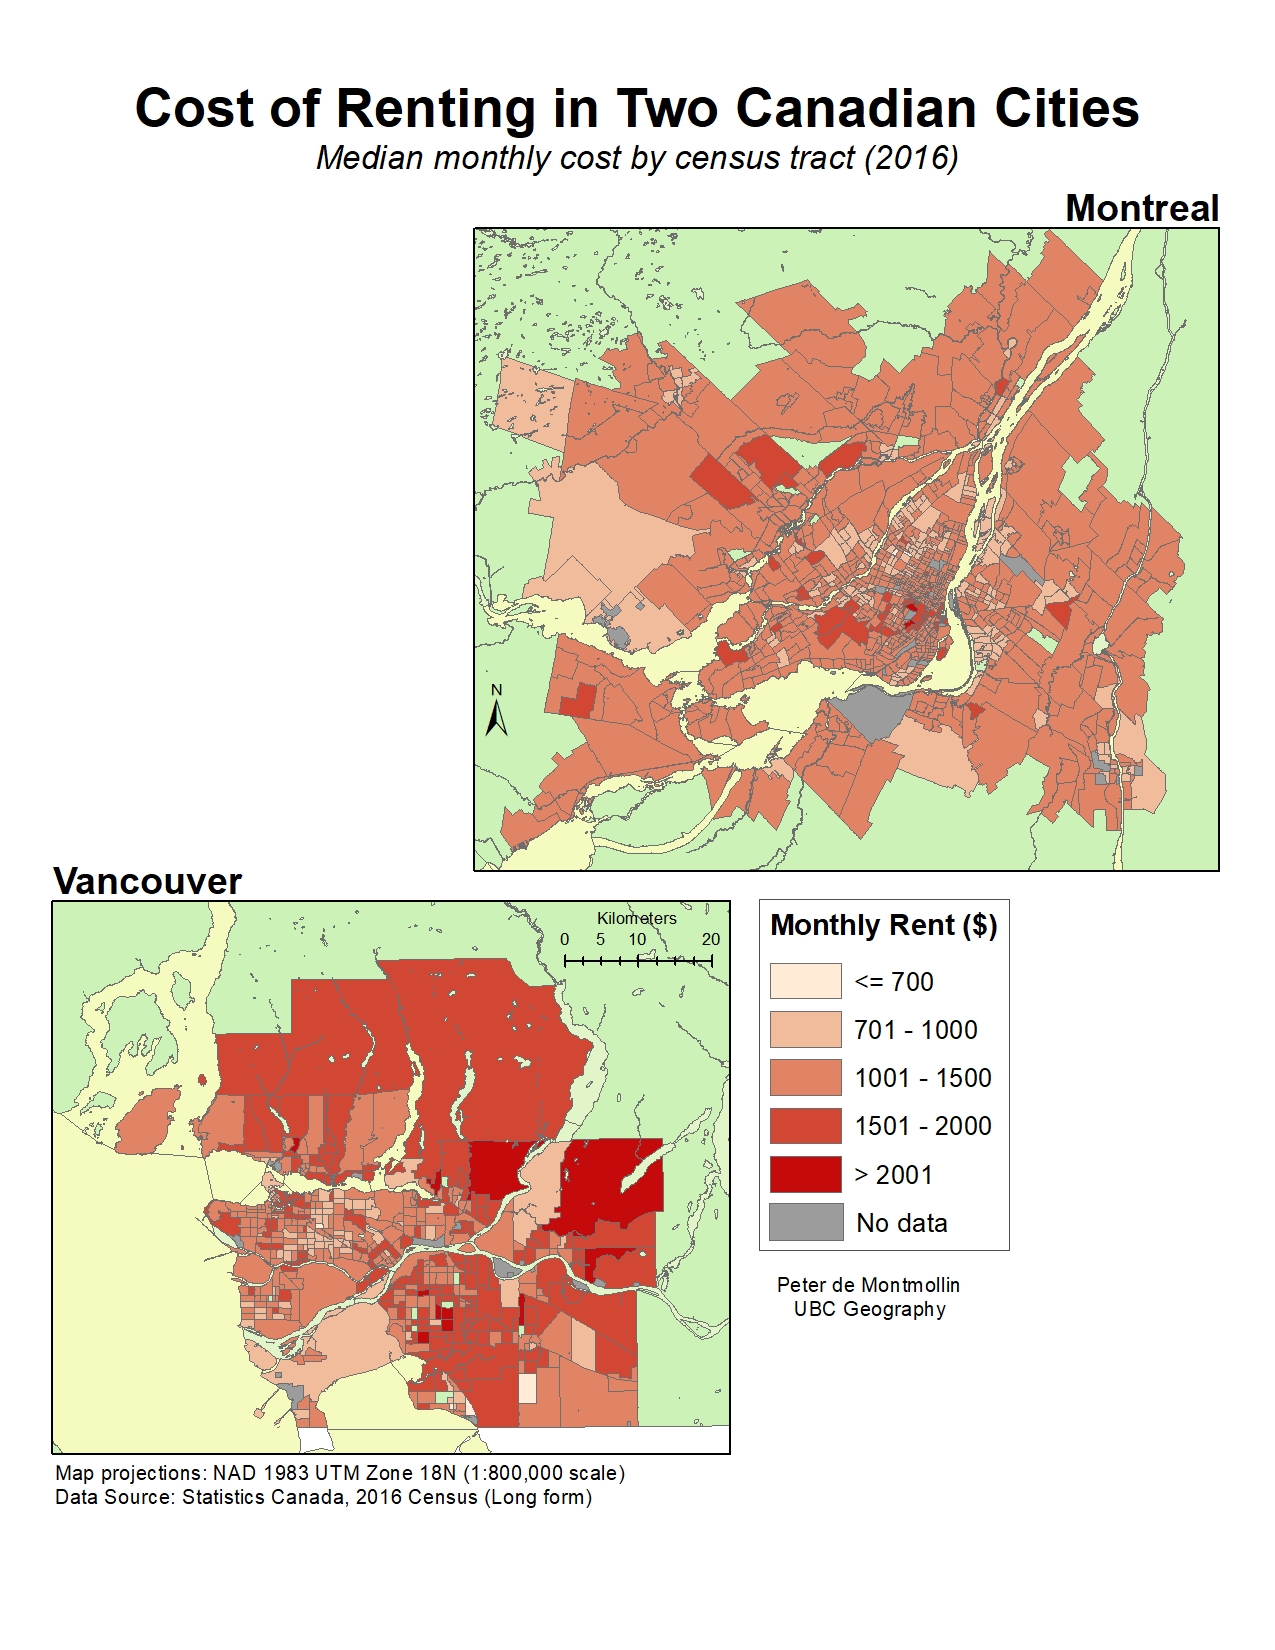
Cost of Rental in Vancouver and Montreal
These maps compare the median monthly cost of renting in Vancouver and Montreal, again using data taken from the 2016 long-form census of Canada and organized by census tract. Since two different datasets are being compared, each was classified using the same manual breaks to allow for a uniform representation. While a necessity in this case, the use of manual breaks might have distorted the data in one or both of the maps. It is also possible that the use of census tracts might confuse interpretations of the maps. For example, Vancouver has several large but sparsely populated areas where the median rent is quite high. As a result, the overall map of Vancouver is a much darker shade of red compared to Vancouver. The grey areas with no data are the result of data suppression by Statistics Canada – usually because the tract is on a First Nations reservation, or because there were fewer than 40 survey respondents in that area.
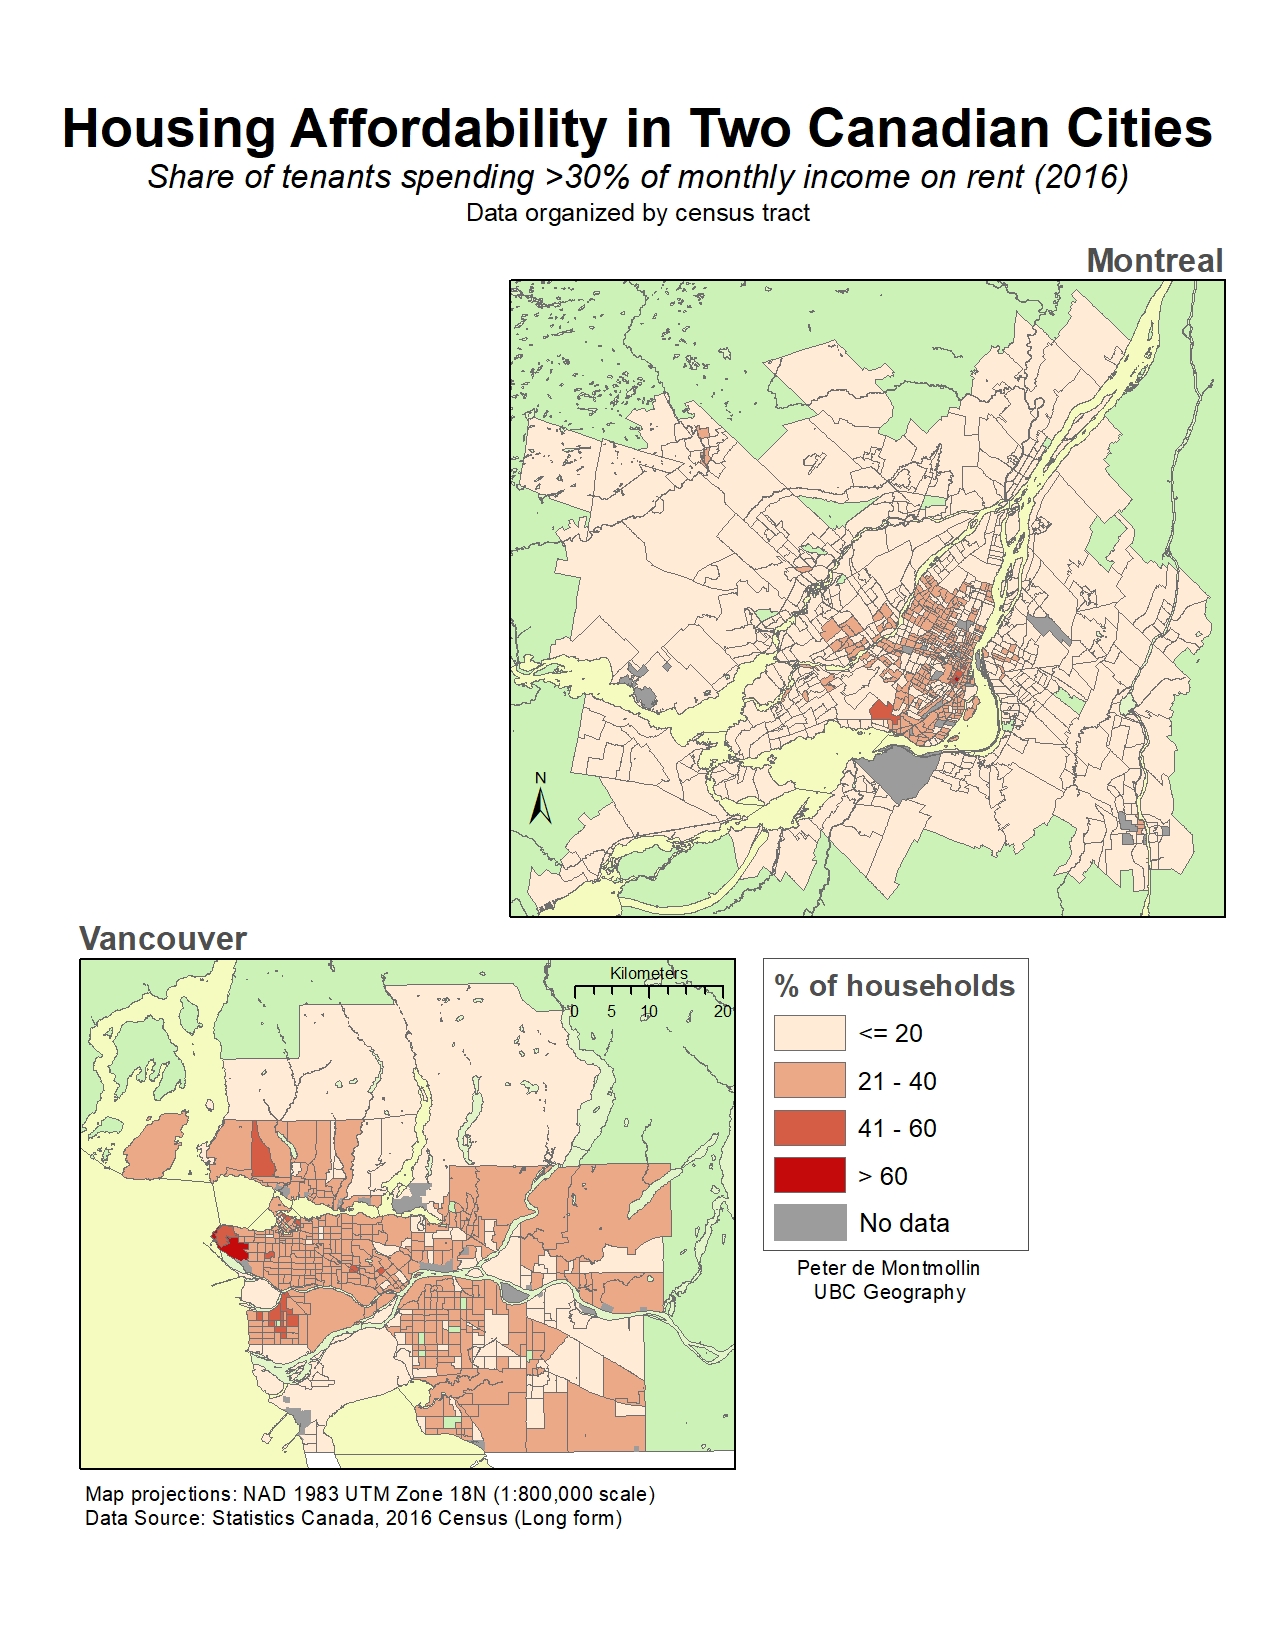
Affordability of Shelter
This final set of maps compares the affordability of housing in Vancouver and Montreal. In this case, Affordability is based on housing costs in relation to income. The maps show the percentage of people who spend more than 30% of their monthly income on rent. This data, again from the 2016 long-form census of Canada, is organized by census tract. This measurement accounts for the monthly financial burden of rent on tenants, making it a better indicator of affordability than rental cost by itself. Affordability, in general, is a good indicator of a city’s livability, although the exact definitions and benchmarks would likely need to be adjusted from country to country, or even region to region, depending on the case. For example, in a country without a public health system or extremely high levels of personal debt, it might be necessary to adjust the >30% threshold or develop an entirely different indicator.