Summary
This project maps the history of Chile’s central power grid (Sistema Interconectado Central, or SIC) from 1940 to the early 2000s. The time period covers the SIC’s origins in 1940s, growth and initial interconnections during the 1950s and 1960s, and consolidation as Chile’s largest power system in the final decades of the 20th century. The SIC’s expansion is visualized through growth of transmission lines and power stations (most of them hydroelectric). This infrastructure has been juxtaposed with historical census data – population density and urbanization rates – permitting the visualization the power grid’s spatial evolution in conjunction demographic shifts that occurring in Chile during the latter half of the 20th century. The data created for the project also serve as a starting point for future historical GIS analysis.
A Note on the Data
Data were acquired from two principal sources: Chile’s Energy Ministry (Ministerio de Energía) and National Statistics Institute (Instituto Nacional de Estadisticas, or INE). The Energy Ministry, on its Energia Maps website (http://energiamaps.cne.cl/), provides downloadable shapefiles of vector data for transmission lines and power plants, which contain startup dates for individual plants and lines, as well as other technical information. INE’s website (https://www.ine.cl/) has PDF copies of the historical censuses from the 19th century to the present. The institute has also uploaded to the ArcGIS Online website shapefiles for the administrative units used in the census years relevant to this study (under user profile “gisine1”).
The Energy Ministry shapefiles required extensive cleaning to add or correct startup dates, as well as correct topology errors and digitalizing missing features when these could be identified. This was done using a selection of primary and secondary textual sources and historical maps. Several columns of extraneous data were removed from the attribute tables as well. The INE census data was scraped from the PDFs and then joined to the corresponding administrative unit shapefiles. The population data acquired, at the provincial or regional level, included urban population, rural population and total population (definitions varied from year-to-year). I documented the data cleaning process, as well as the general challenges presented by this project, in a Methodology appendix, which I am happy to share on request.
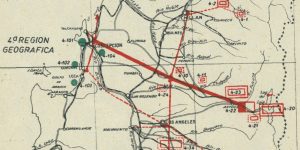
Generally, these maps should be seen as preliminary. Although some degree of imprecision and uncertainty is unavoidable when working with historical sources, it is highly likely that the data underlying these maps could be improved by consulting additional sources. This is especially true of the vector data on the power system's infrastructure. For example, the 1940s maps show only part of the system that had developed around Santiago. I also intend to revisit the historical census data to determine if there is a better indicator of urbanization that does not vary as significantly from census year to census year.
I will update the maps in this post as I am able to improve or correct the data. I also welcome all suggestions, corrections or comments. And now, on to the maps.
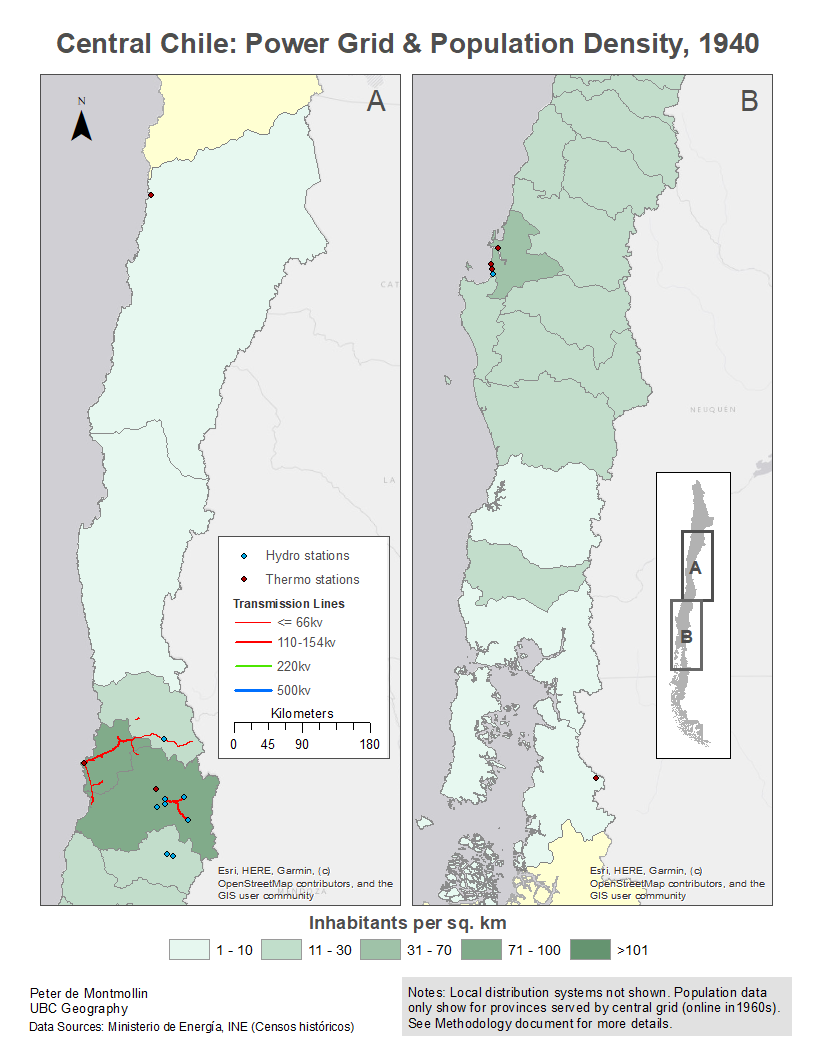
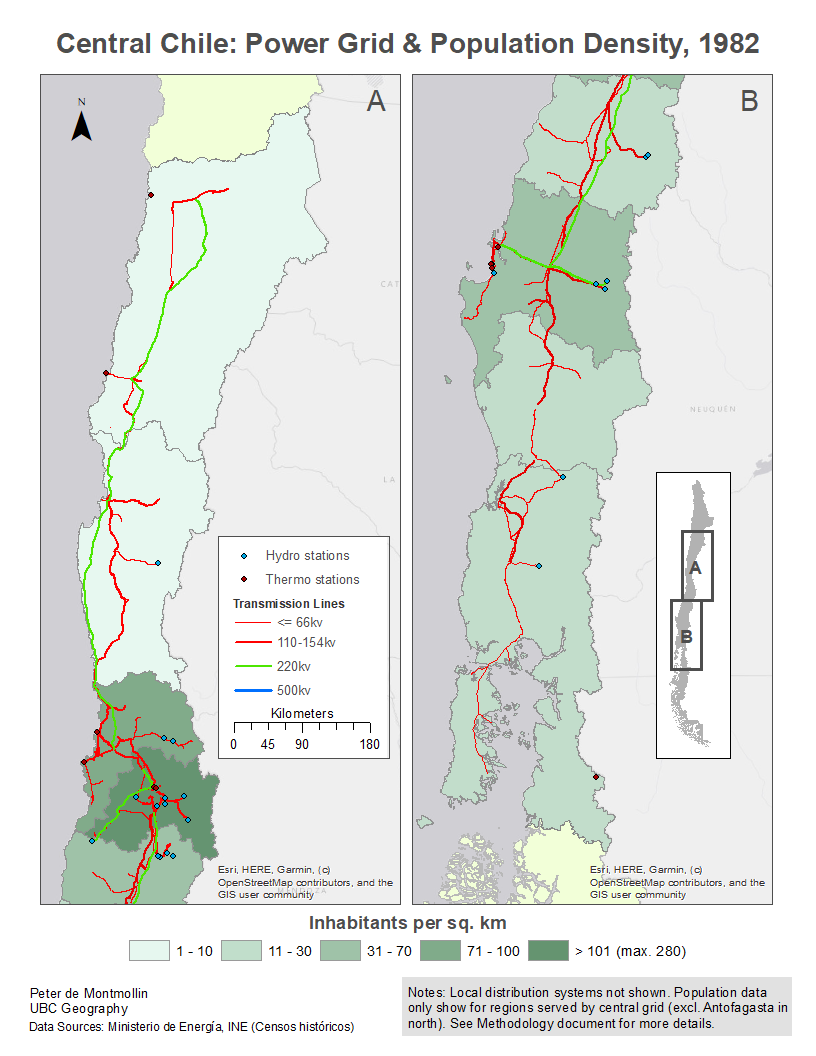
Population Density
These maps show the emergence of the SIC between 1940 and 2002, over four-year intervals that correspond to census years. They also show changes in population density (persons per sq. km.) over time at the provincial and regional level. The shift from provinces to regions as Chile's main administrative unit occurred in the 1970s. Because the regions are much larger than the provinces, the density data is somewhat diluted between 1960 and 1982. I classified the data using manual breaks to allow for comparisons between the maps, which likely obscured some internal variation in the data for individual census years. (Click the images to enlarge.)


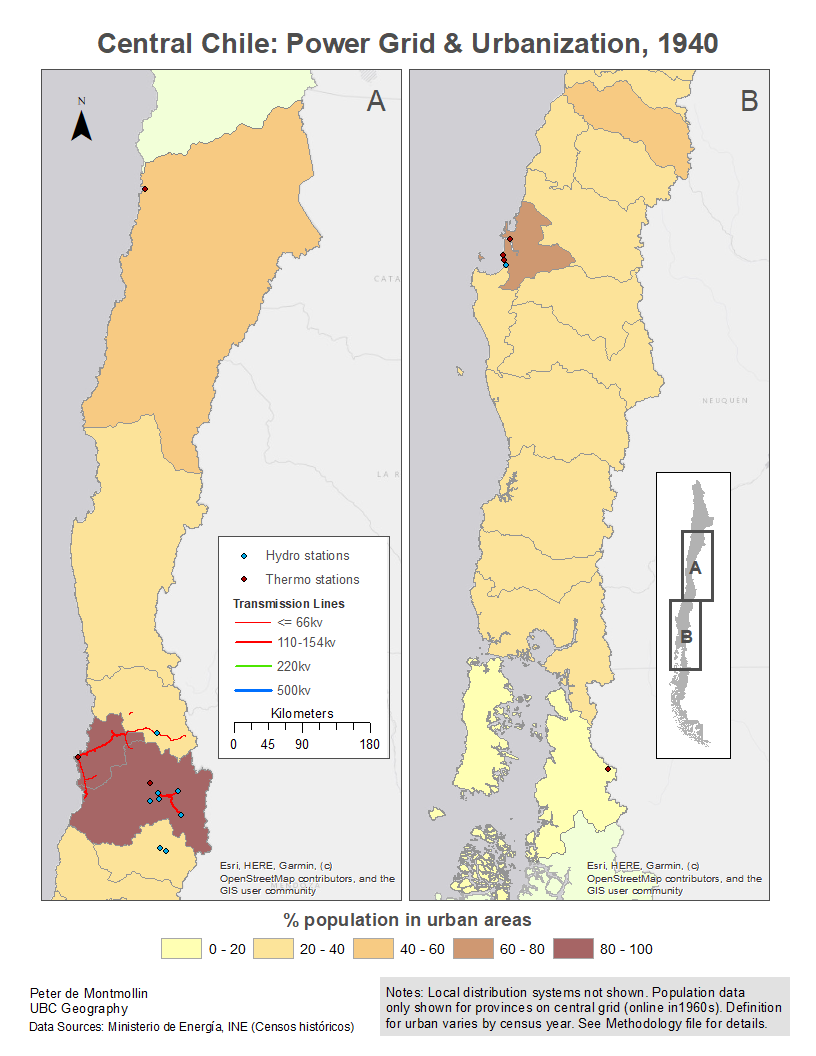
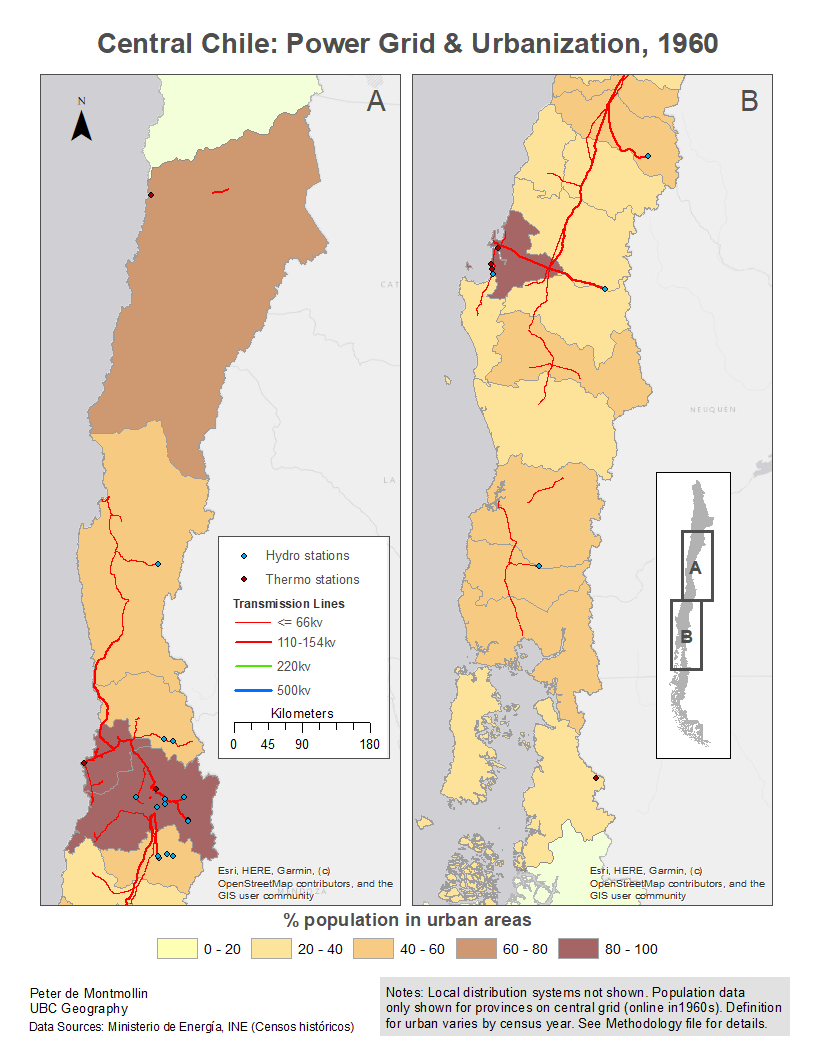
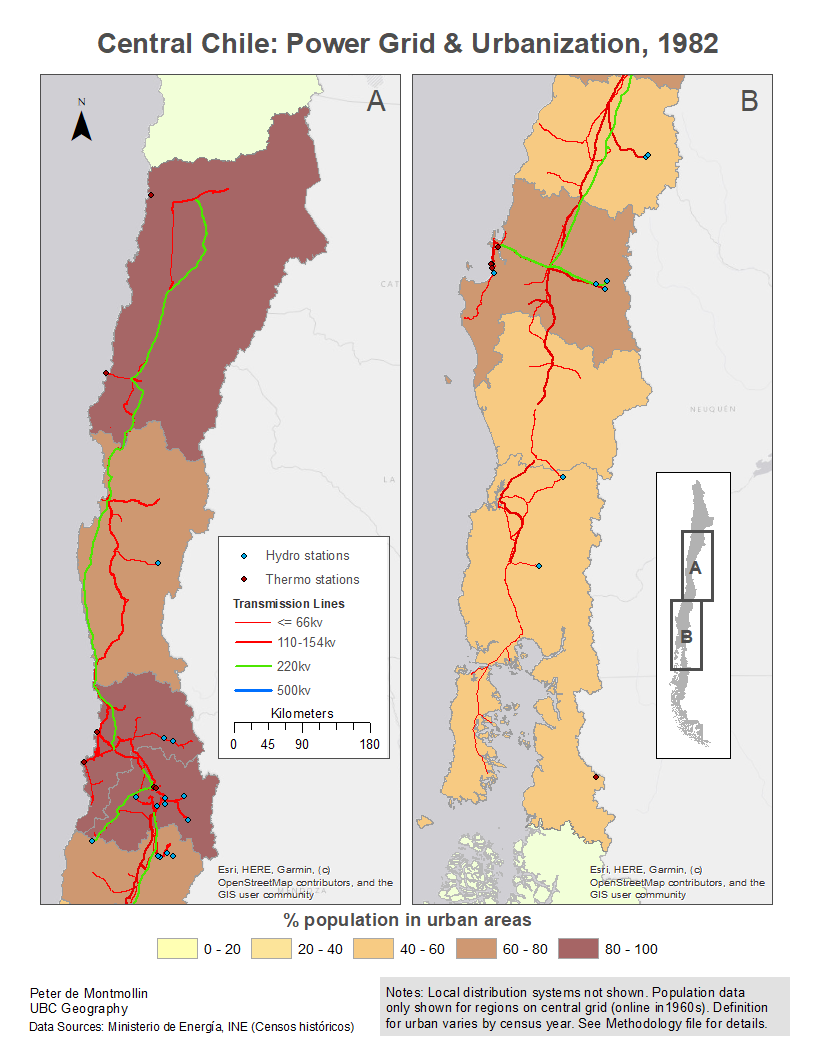
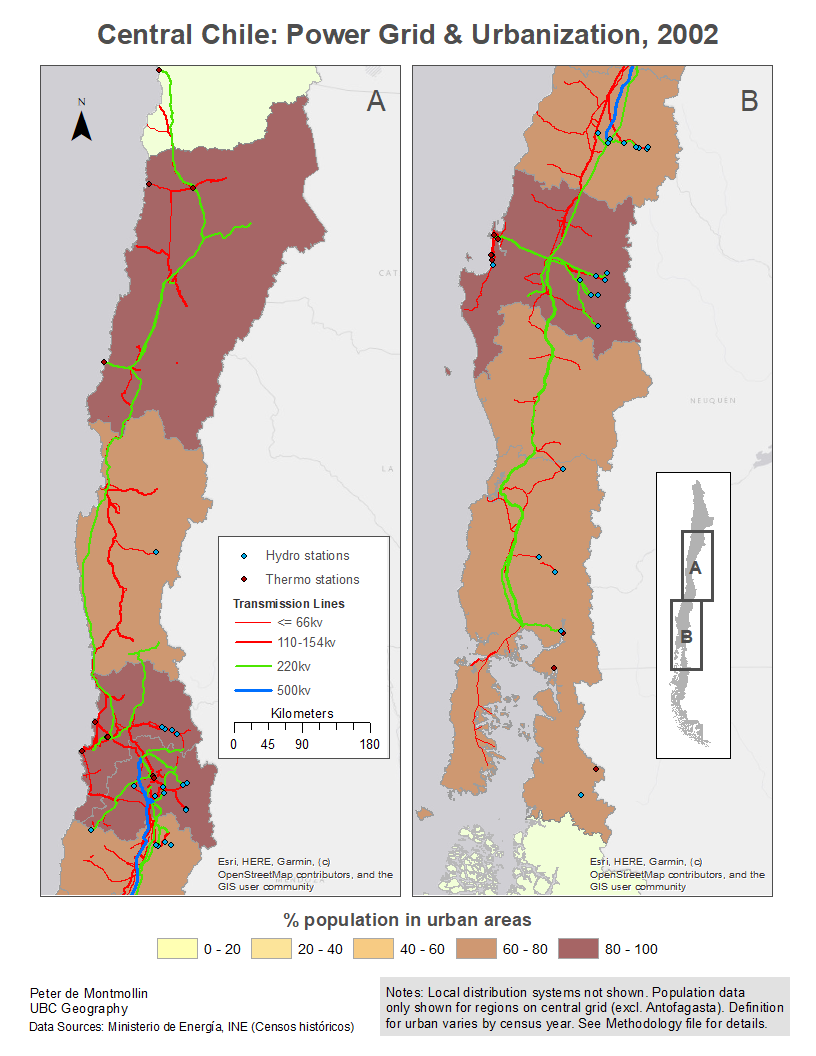
Urbanization
The other maps again shows the grid, at the same four census years, but with urbanization rates (% of population in urban areas). The same caveats apply to this data as the previous maps, although the manual breaks are less distorting in this case. However, it should be mentioned that the definition of urban area varies from census to census. The Methodology appendix provides more details. (Click the images to enlarge.)
Bibliography
For those interested, below is a list of the main primary and secondary sources I used for the data cleaning.
Brokering Ch., W. 1976. Evolución histórica del sistema interconectado chileno. In La energía eléctrica en Chile: algunos aspectos de la labor de la ENDESA, ed. AIE, 103–151. Santiago, Chile: Asociación de Ingenieros de ENDESA (AIE).
CNE. 2019. Reporte Capacidad Instalada Generación, Diciembre de 2019. Santiago, Chile: Comisión Nacional de Energía.
CORFO. 1942. Plan de electrificación del país de la Corporación de fomento de la producción, Chile: directivas generales y plan de electrificación primaria del país. Santiago, Chile: Imprenta y litografía Universo.
ENDESA. 1956. Plan de electrificación del país: Segunda publicación. Santiago, Chile: Empresa Nacional de Electricidad S.A. (ENDESA).
ENDESA. 1986. Producción y consumo de energía en Chile 1986. Santiago, Chile: Empresa Nacional de Electricidad S.A. (ENDESA).
ENDESA. Various dates. Producción y consumo de energía en Chile.
“Nuestras obras: Líneas de transmisión.” Boletín Endesa (Santiago). No. 50, September 1958
Nazer Ahumada, R., J. R. Couyoumdjian, and P. Camus Gayan. 2005. CGE: Cien años de energía en Chile, 1905-2005. Santiago, Chile: Ediciones Universidad Católica de Chile.
Yáñez, C. 2017. El arranque del sector eléctrico chileno: Un enfoque desde las empresas de generación, 1897-1931. In Empresas y empresarios en la historia de Chile: 1810-1930, eds. M. Llorca-Jaña and D. Barría Traverso, 175–192. Santiago, Chile: Editorial Universitaria.