Lab Summary
This lab asked us to assess the flooding risk to infrastructure in different areas of Metro Vancouver. The maps below visual areas vulnerable to storm surges of up to 5 meters. Vulnerability in this case refers to all areas within one 1km which are at or below an elevation of 5 meters. The data for all three maps was obtained from federal and city sources.
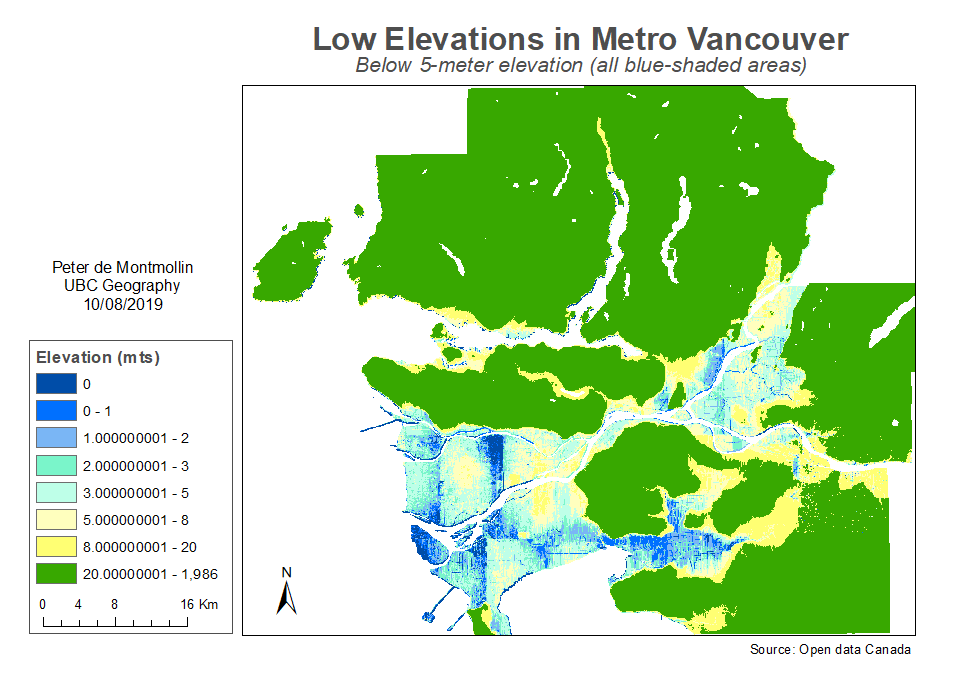
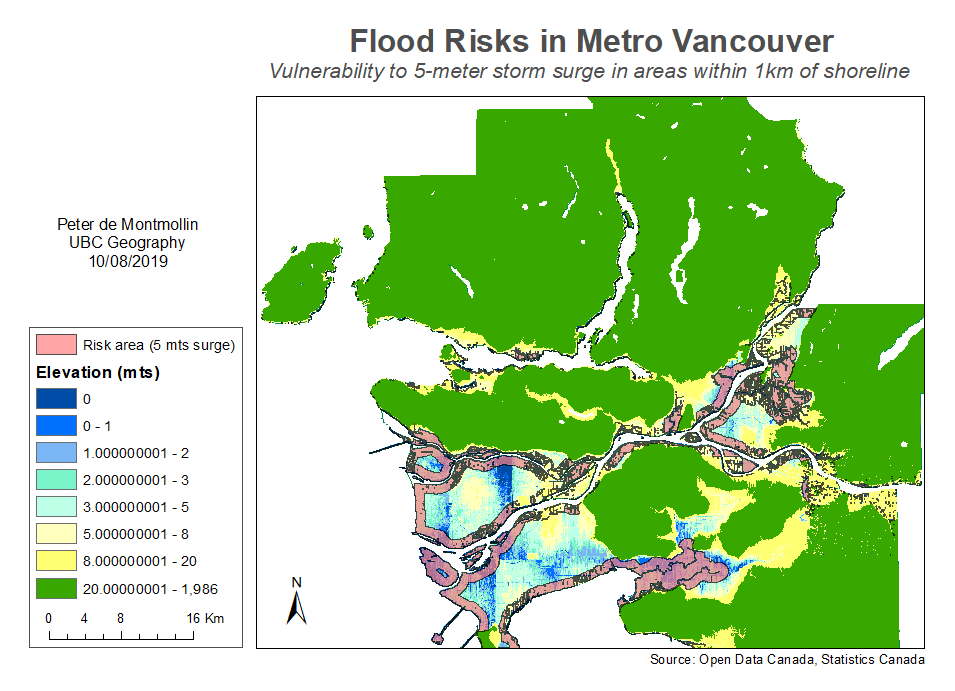
25-mt Resolution
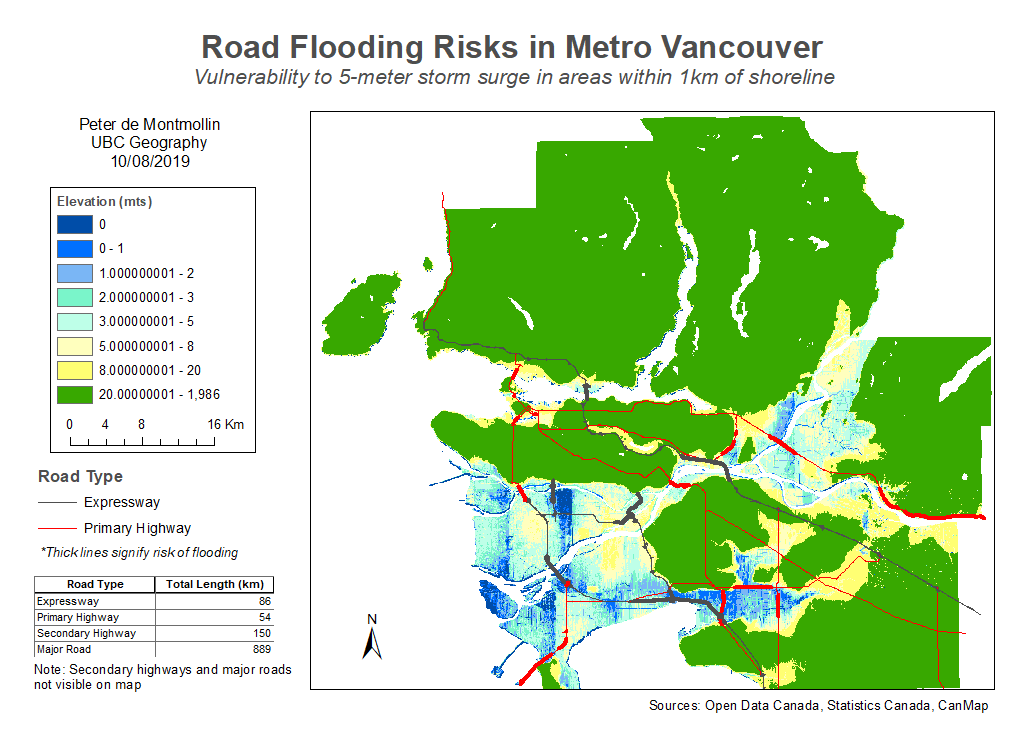
The first three maps were created using a digital elevation model (DEM) with a resolution of 25 meters. “Low Elevation Areas in Metro Vancouver” reclassified the original raster layer to distinguish between different ranges of elevation. For “Flood Risk Areas of Vancouver,” I used a vector layer converted from the reclassified raster layer to show a 1km buffer zone along the shoreline; all areas within that zone are at or below a 5-meter elevation and are thus vulnerable to the storm surge scenario. Finally, “Road Flooding Risks in Vancouver” overlays a vector layer of the Vancouver road network to determine which major highways pass through flood risk areas. The highway sections at risk are highlighted as thicker lines, while the table on the bottom-right summarizes the total length of each road type. In this map, the display scale makes it difficult to visualize the infrastructure that is not at risk, while the DEM resolution of 25 meters might introduce some error into the interpretation of at-risk roads.
Map 1
Map 2
Map 3
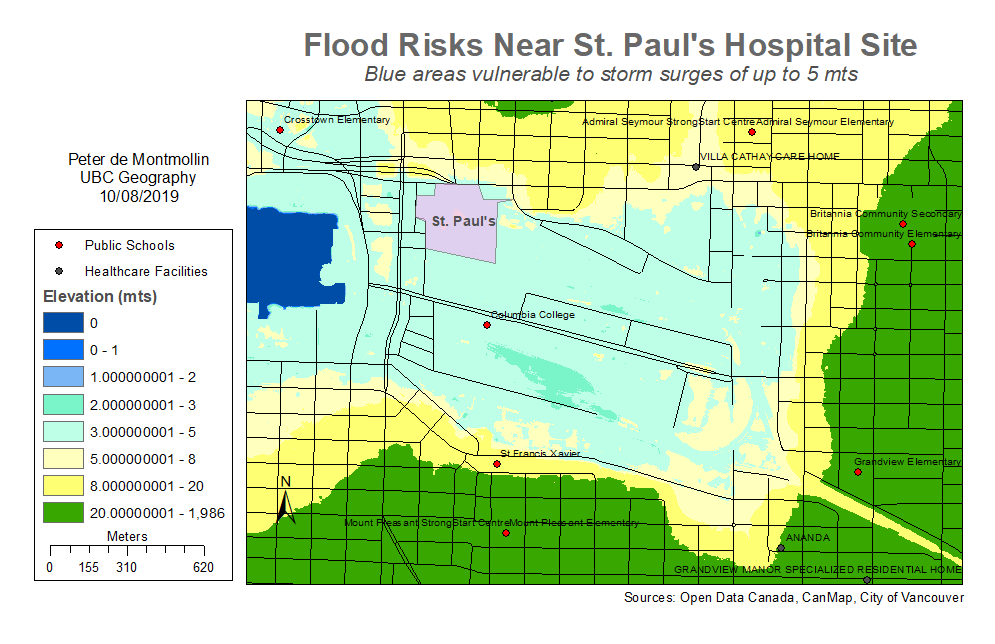
1-mt Resolution
The final map was created using a DEM with a resolution of 1 meter. It shows that the proposed St. Paul's Hospital as well as several existing schools are vulnerable in the storm surge scenario. Healthcare facilities are also displayed, although none are located in vulnerable areas. The higher-resolution DEM also shows the limits of the previous buffer zone interpretation, which was created from the 25-meter DEM. Neither the schools nor the hospital site fall within the buffer zone based on the 25-meter DEM, whereas the 1-meter DEM shows they are in areas below a 5-meter elevation. It would be useful to create another buffer zone layer using the 1-meter DEM to refine this analysis.